Dashboard
The Dashboard provides visualization of key metrics for monitoring the authorization performance of the running instances of Access Decision Service (ADS). Click the Dashboard link in the navigation control bar to access it.

If the "Feature disabled" message displays, it means that the Dashboard functionality was not enabled during the ASM startup process. See the Disable or enable the Dashboard topic for information on how to enable the Dashboard.
Metrics data flow
The metrics data for the graphs of the Dashboard are published by ADS, which can be configured to use ASM as a metrics backend and send the data to an instance of InfluxDB running within ASM. See ADS docs: MetricsOpens in a new tab for more information.
If ADS has not been configured to publish metrics to ASM, no domains or ADS instances will be available to select and the graphs in the Dashboard page will be empty.
The filter panel
On the left side, there is a filter configuration panel, where you choose the domain for which you want to display metrics, and select which ADS instances to include.
- Click Collapse to close the panel and allow the graph section to use the entire page.
- Click Expand filters to display the panel again.
Domain
To select a domain for which to see the metrics, click the Choose domain drop-down menu in the filter panel and make a selection.
ADS instance
An authorization domain can be used by several instances of ADS. You can create a filter to refine the data displayed in the graphs to only include a particular set of ADS instances.
Click the search field under the ADS instance label.
A drop-down list with the ADS instances connected to the selected domain displays.
You can narrow the selection by typing the name of an instance in the search field.
noteIt is a dynamic search; for every character you type, the list of potential ADS instances gets shorter.
Select the ADS instance(s) to include, or click the Select all checkbox.
The selected instances display under the domain name in the main panel.
The main panel
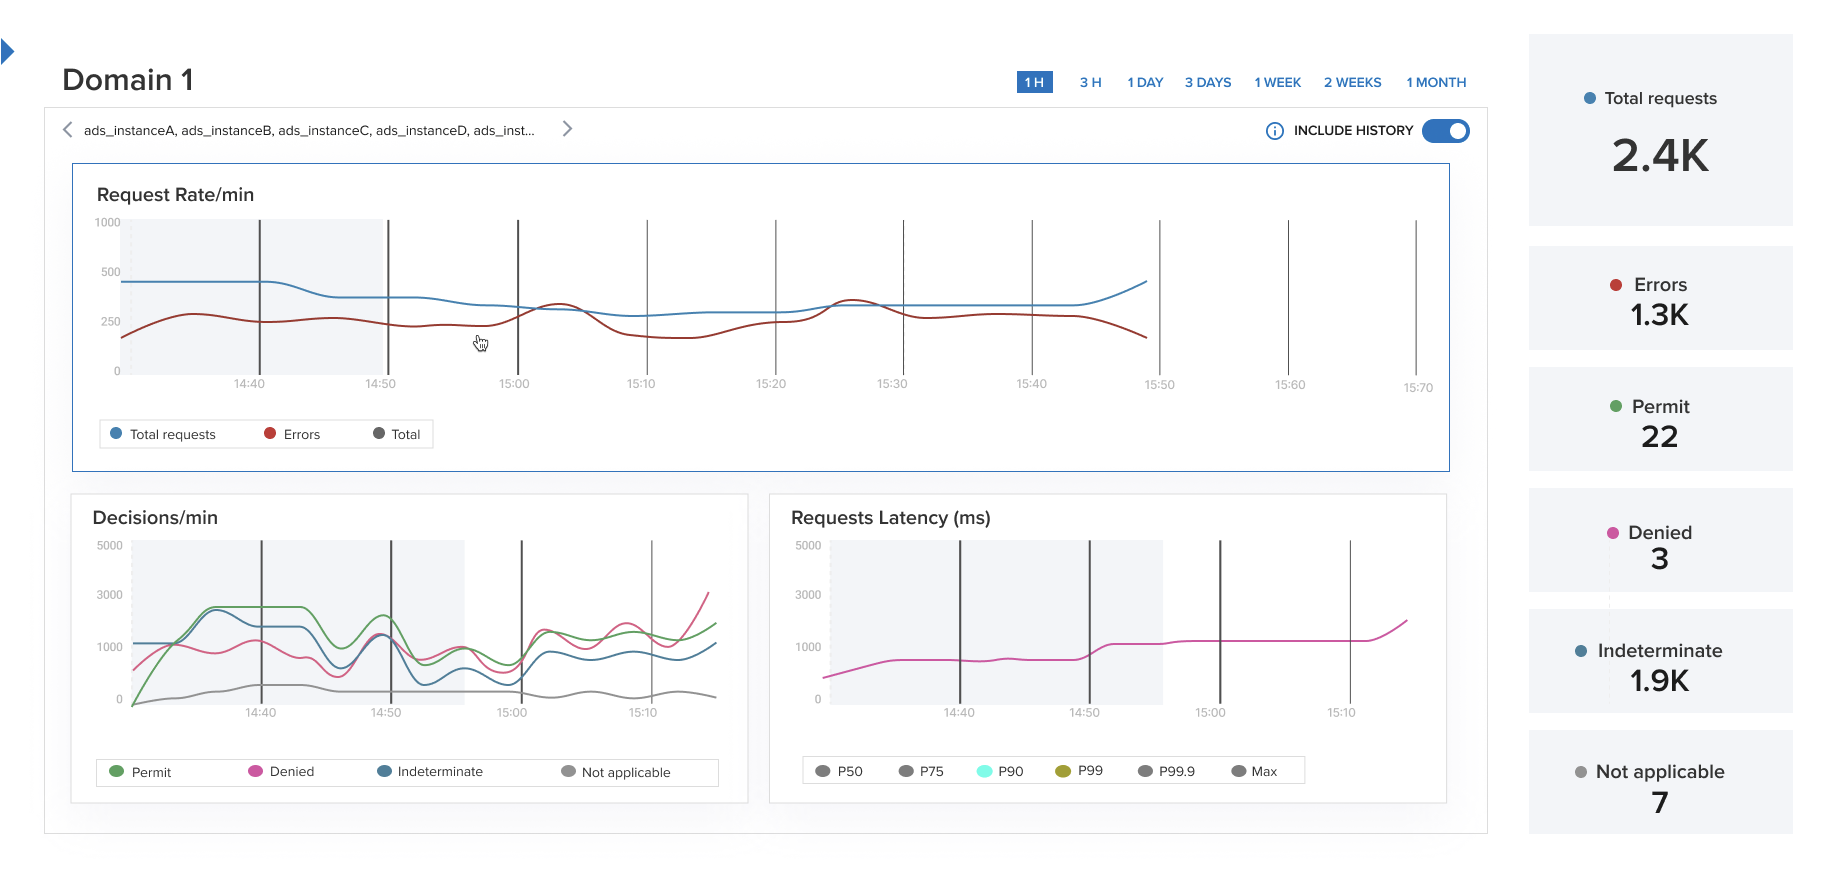
The main panel shows the name of the selected domain and ADS instances. This is also where you set the time interval for the graph displays.
Time interval
The interval for the data display is controlled by the time period selection in the upper right corner of the main panel, ranging in steps from 1 hour to 1 month.
Include history
Under the time setting, an Include history toggle switch exists. Use it to control whether to include historical data in the graphs. The authorization metrics data displayed is related to the selected active domain name, which means the toggle is off by default. Enable the toggle to also include historical data for this domain name, related to its previous versions.
The graph section
This area of the panel is divided into four sections, each providing a specific type of information.
- Hover the mouse pointer over a graph line to get a read-out of the data at that point.
- Click the individual legends under each graph to switch the display of that item on and off.
- Double-click on a legend to display only that item.
Decisions/min
This section displays the number of authorization decisions per minute made by the selected ADS instance(s), split into the categories Permit, Deny, Indeterminate, and Not applicable.
Request Rate/min
This section shows the rate of requests per minute served by the selected ADS instance(s), split into Successful requests and Errors, respectively. Successful requests are those that evaluated to Permit, Deny, Indeterminate, or Not Applicable.
Request Latency (ms)
This section shows the request latency separated into percentiles, that is, the distribution of the amount of time each access request takes. The latency percentiles are selectable in the graph.
Total requests
This section displays the number of requests as a total and per decision. Errors are reported separately. There is no interactive functionality in this section.