Visual tracing
Visual tracing provides a graphical, interactive HTML visualization of how the Axiomatics Policy DevOps (APD) engine evaluates an authorization decision. It illustrates the exact path the engine takes while processing policy sets, policies, rules, and conditions to reach an authorization decision, showing which elements were triggered.
This feature is especially valuable for debugging, understanding, and validating complex authorization policies. It allows you to see precisely which parts of a policy were evaluated and why a particular decision was made, helping you identify issues or unexpected behavior in your policies.
The HTML report is stored under the build/alfa/tests/trace directory.
Visual tracing is enabled by default. To disable it, set the withVisualTrace parameter to false within the alfa {...} configuration block of your build.gradle file. For example:
alfa {
    namespace "MyProject"
    mainpolicy "acme.Main"
    withVisualTrace false
...
Interface
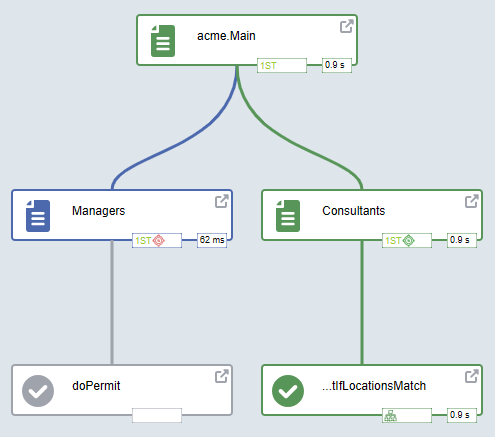
Visual tracing presents an interactive, graphical HTML visualization of the policy evaluation process. It uses a flowchart-like diagram to illustrate the hierarchy and execution path of the authorization decision.
Key elements of the visualization include:
- Nodes and flow: Nodes represent different policy components (policy sets, policies, rules, etc.) connected by lines that trace the evaluation flow.
- Evaluation path & timing: The lines show the exact path the APD engine took, often including labels to indicate the order and time taken for each step.
- Interactive detail panel: Hovering over any node opens an overlay panel providing element-specific details.
Side panel
The side panel provides essential controls for customizing the visualization and a color-coded legend for interpreting the diagram's flow.
| Control | Function | Shortcut |
|---|---|---|
| Show not evaluated nodes | Toggles the display of policy elements that were skipped during evaluation. | E |
| Developer mode | Enables advanced details on the visualization. | D |
| Horizontal layout | Changes the flowchart orientation from vertical to horizontal. | H |
| View | Allows you to change the focus of the visualization. The default view is Policy, but you can switch to views like Dictionary, Attribute connectors, or Request. | V |